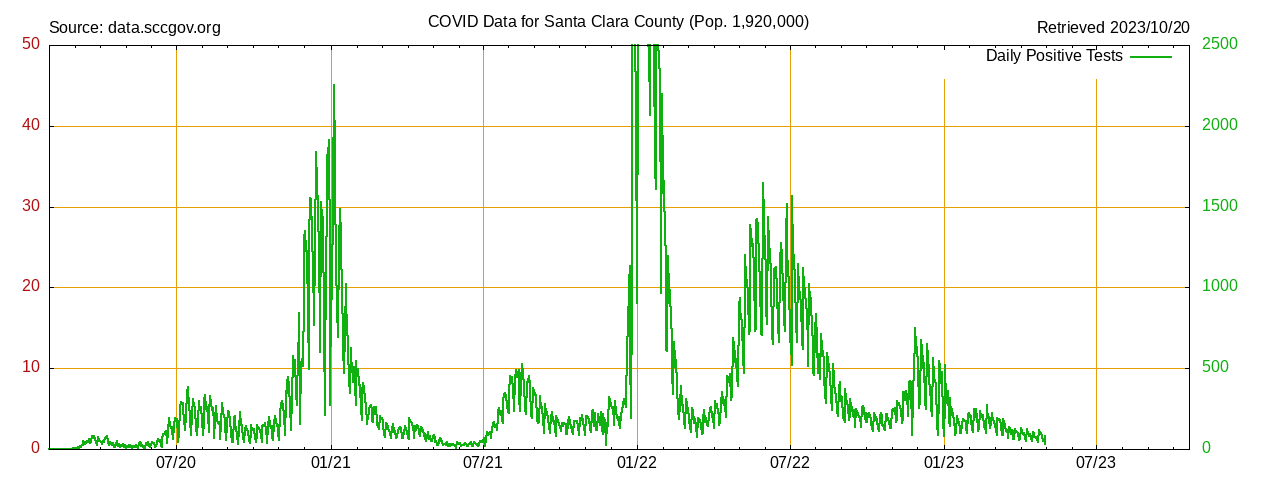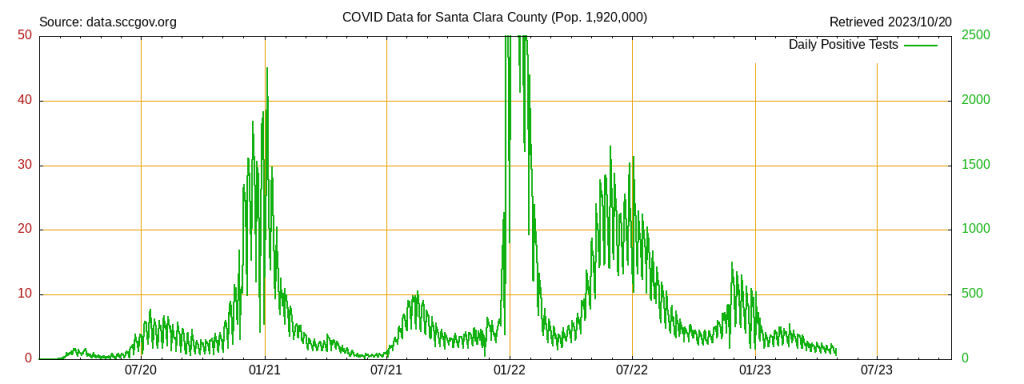
The graph below is automatically updated daily with unmodified data obtained directly from the County of Santa Clara’s data site. The plot overlays the cases and deaths, and doesn’t censor the final week which is understood to have data that may still be changing.
NOTE: The County API stopped working in late May, 2023 so this site is no longer updating.
Click on the image for larger view.